
Flux includes a powerful code tool that allows you to generate and execute Python scripts for data analysis, visualization, and complex calculations directly from the chat interface. This tool helps you perform advanced operations that go beyond simple calculations without having to set up a separate programming environment.
Overview
The code tool enables you to:
Generate and execute Python code based on natural language descriptions
Create visualizations such as graphs, charts, and plots
Perform complex data analysis and calculations
Simulate circuit behavior and analyze results
Generate reports with formatted output
How to Use the Code Tool
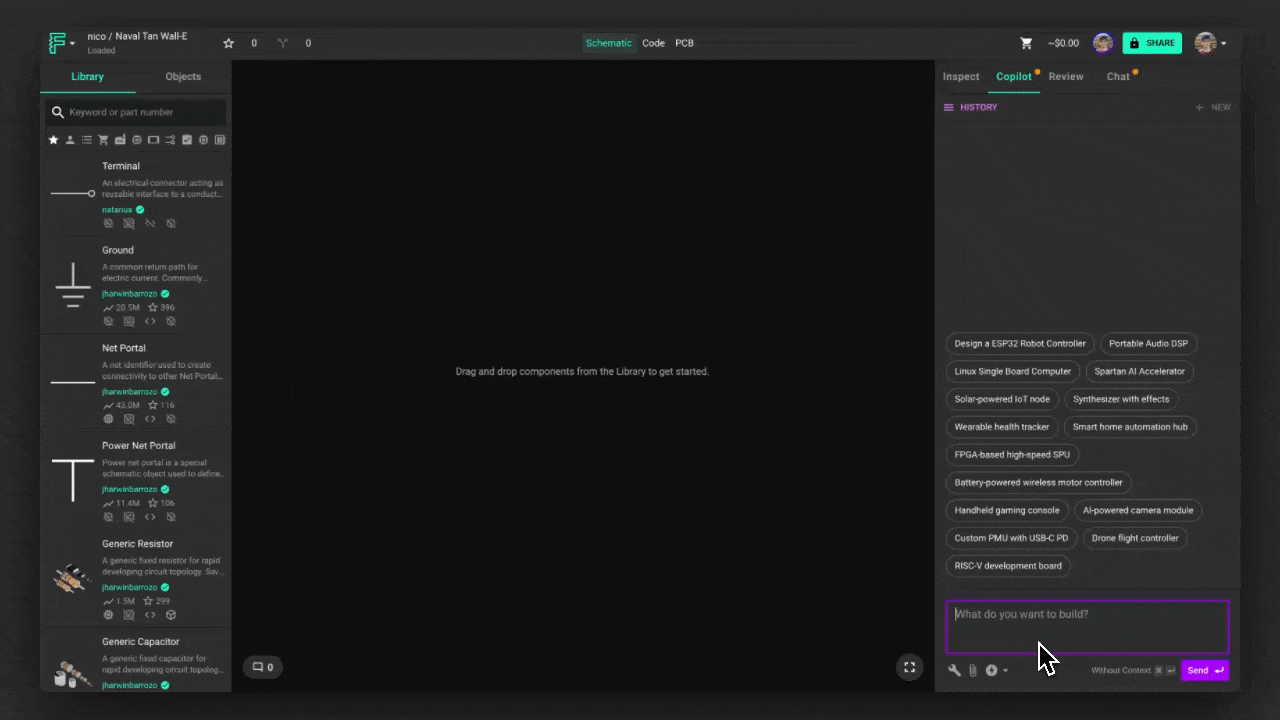
To generate and execute Python code using Flux, use the @code tool in your query:
When you use the @code tool, Flux will:
Generate Python code based on your description
Execute the code using a secure Python interpreter
Return the results, including any text output, tables, or visualizations
Provide the generated code for your reference
Python Libraries
The code tool has access to many popular Python libraries for scientific computing and visualization:
Data Analysis and Computation
NumPy - For numerical computations and array operations
SciPy - For scientific and technical computing
Pandas - For data manipulation and analysis
SymPy - For symbolic mathematics
Visualization
Matplotlib - For creating static, animated, and interactive visualizations
Seaborn - For statistical data visualization
Plotly - For interactive, publication-quality graphs
Electronics and Signal Processing
PySpice - For circuit simulation
SciPy Signal - For signal processing functions
Example Use Cases
Here are some examples of how you can use the code tool:
Circuit Analysis and Simulation
Data Visualization
Complex Calculations
Working with Data
The code tool can work with data from various sources:
Manual Input
You can provide data directly in your query:
Attached Files
You can attach data files (CSV, TXT, etc.) to your chat and reference them:
Generated Data
You can ask the code tool to generate synthetic data for analysis:
Output Formats
The code tool can generate various types of output:
Text Output
Simple text results for basic calculations and analysis.
Tables
Structured data presented in tabular format for easy reading.
Visualizations
Graphs, charts, and plots rendered as images in the chat.
Interactive Elements
Some visualizations may include interactive elements for exploring data.
Tips for Effective Code Generation
To get the most out of the code tool:
Be specific about your requirements - Clearly describe what you want the code to do, including any specific parameters or methods.
Specify visualization details - Mention axis labels, titles, and other formatting preferences for charts and graphs.
Break complex tasks into steps - For very complex analyses, consider breaking them into a sequence of simpler steps.
Reference specific libraries if needed - If you know you want to use a particular library or function, mention it in your query.
Limitations
While the code tool is powerful, it has some limitations to be aware of:
Execution time is limited, so very complex computations may time out
Available memory is restricted, limiting the size of datasets that can be processed
Not all Python libraries are available in the execution environment
The tool cannot access external resources like websites or databases
Generated code runs in a sandboxed environment for security reasons
Related Features
The code tool works well with other Flux capabilities:
Help Tool - Search Flux Editor documentation for guidance
File Tool - Extract information from datasheets
Calculator Tool - Perform simpler calculations
Simulator Tool - Run SPICE circuit simulations
Getting Started With Flux - Learn the basics of using Flux